Please note that you require Organisation Batch Admin Rights to access these pages, which are only available to regulator users.
The Batch flows is accessed via Admin pages, Batch Jobs.

To complete a batch flow estimate you require the outlet locations on the Qube drainage network (nodes along each stretch of the drainage network defined on a 50m grid). For a new set of catchments, the outlet snap should be used first to snap your list of coordinates to the drainage network outlets.
Create a new flow estimate batch
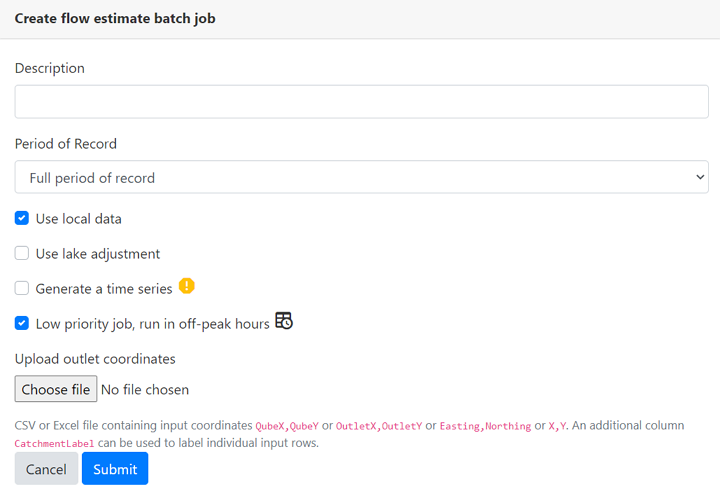
Create a new flow estimate batch job via  , which opens the following form.

The flow estimate batch has the same options as a standard flow estimate for period of record and use of local data (plus lake adjustment in Scotland).
As default, the batch will run during off-peak hours (overnight and weekends). This will reduce the load on the Qube servers during working hours.
You have the option to also generate time series. Note this will take significantly longer and can only be run during off-peak hours.
Upload the Qube outlets file downloaded from the outlet snap batch containing the outlet coordinates. Alternative csv or excel files can be uploaded that contain the outlet coordinates on the drainage network with the header named QubeX,QubeY or OutletX,OutletY or Easting,Northing or X,Y.
You can optionally include a Catchment Label in the input csv for some or all of your outlets. This can then be used to reference your results, and can be persisted through all stages and exports of the outlet snap and flow estimate batches. The Catchment Label field is optional and can be left blank.
Reviewing the results
You can view progress on running batches, as shown below, and you will also receive an email once the batch is complete.

You are then able to download  the results, update
  the batch job with new outlet coordinates, or delete
  a batch job.

The flow estimation batch provides the following downloads:
- Batch info (e.g. batch name, batch date, user, using local data)
- Catchment results (e.g. area, runoff, SAAR, HOST)
- Annual and monthly flow duration curves (e.g. annual and monthly 101 point FDC for natural and influenced flows)
- Annual flow duration curves with descriptors (e.g. area, runoff, SAAR, HOST, annual FDC for natural and influenced flows)
- Summary of influences within each catchment (e.g. annual and monthly total influence in m³/s differentiated by GWABS, SWABS, DIS, IMP, COMP)