Generating a climate change adjusted FDC
You can generate climate change adjusted flows for your catchment under the 'UKCP18 climate change' tab.
For details on the methods used to generate these climate change adjusted flows, please go to the description of climate change in the science section, which includes a climate change glossary.
In summary, the climate-change-adjusted flows are generated using the UKCP18 eFLaG meteorological datasets and the CERF2-HadUK generalised rainfall-runoff model. Climate-change-adjusted flows, and the associated percentage changes, for key FDC exceedence percentiles, and annual and monthly mean flows, are calculated for the near future (2020 - 2049) and far future (2050 - 2079) for the RCM (Regional Climate Model) 12-member perturbed parameter ensemble (PPE) at TSEP catchments. Qube selects an appropriate donor TSEP site and applies these percentage changes to the site of interest.
You can view or export either the adjusted FDCs or mean flows for either the near or far future for each of the 12 RCM runs.
Flow duration curves
The natural (full POR) FDC is shown on the graph and you can select the climate change adjusted FDCs for each RCM individually or as a group for each epoch.
Tools tips show you the flows at selected percentiles for each RCM run.
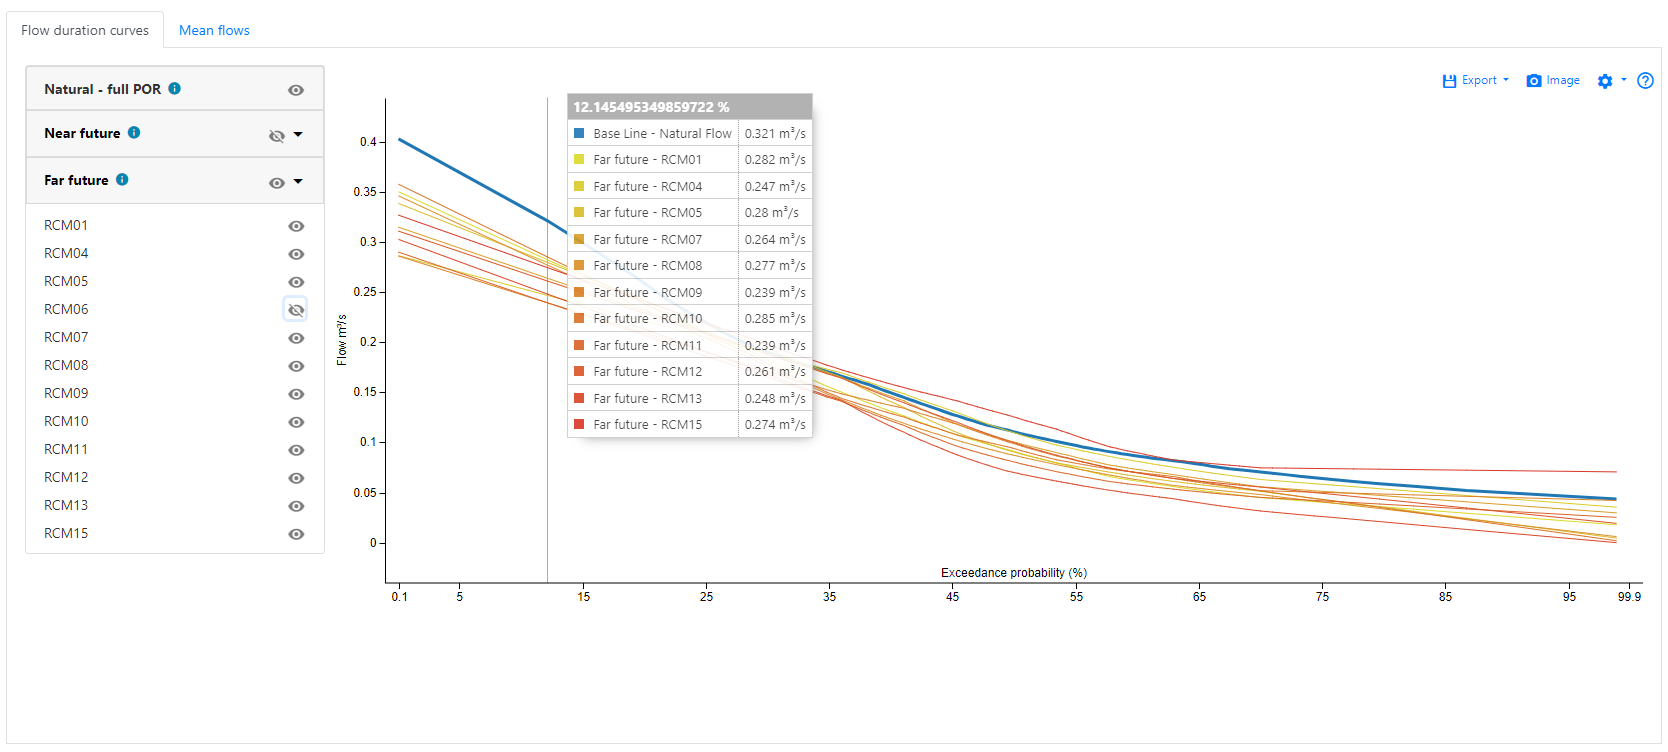
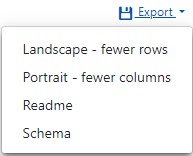
The data can be exported in two CSV formats: landscape and portrait. Qube also provides two other files (Readme and Schema) that provide additional information on the use and structure of the datasets.
The landscape export contains more columns and is formatted for legibility and easier analysis in a spreadsheet.

The portrait export has fewer columns and is formatted for easier parsing and analysis with programming or scripting languages such as Python or R.
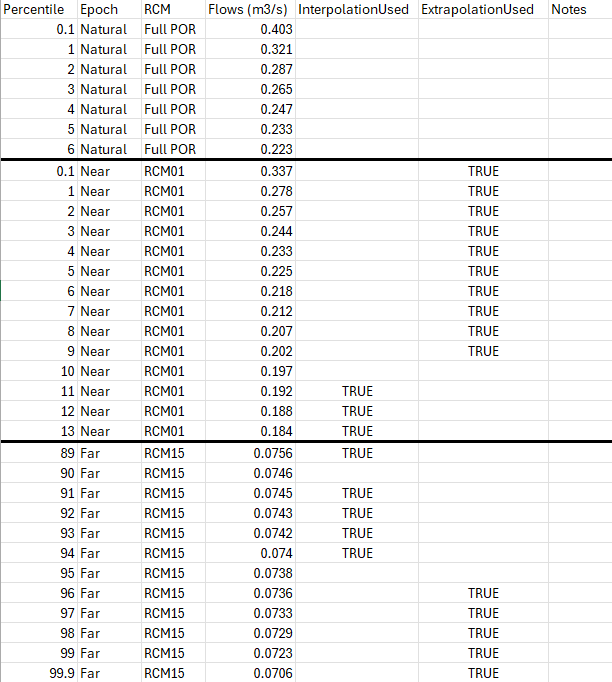
The 'Notes' field is used for occasional advisory information, such as
-
'High percentage change' - this indicates that the raw percentage change from the donor TSEP catchment is greater than 100%. This can occur where the baseline flow is very small (at high exceedence percentiles) and the small change in flow represents a large percentage change. Care should be taken when using these flow values.
-
'Flow adjusted to ensure validity of the FDC' - sometimes the transfer of the percentage changes from the TSEP catchment to the ungauged catchment can result in the flows not always decreasing as the exceedence percentile increases. If this occurs, the flows in the FDC for the higher exceedence percentiles are adjusted downwards to ensure that the FDC remains valid.
The portrait export includes two further fields 'InterpolationUsed' and 'ExtrapolationUsed':
- These are TRUE where interpolation or extrapolation has been used. Percentage changes are generated at key exceedence percentiles, and these are then interpolated and extrapolated into a full 101-point FDC. Log-normal interpolation is used between Q10 and Q95, with linear-normal extrapolation used outside these limits. Note that there will be higher uncertainty associated with interpolated or extrapolated values.
You can save the graph to a PNG using the camera icon.
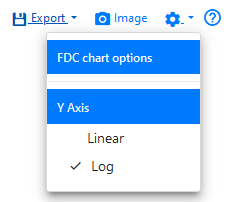
You can change the y-axis on the FDC graph using the settings icon and drop down menu.
The question mark icon links to the relevant section of the user guide.
Mean flows
The annual and monthly mean flows are presented for all RCMs in the 'Mean flows' tab.
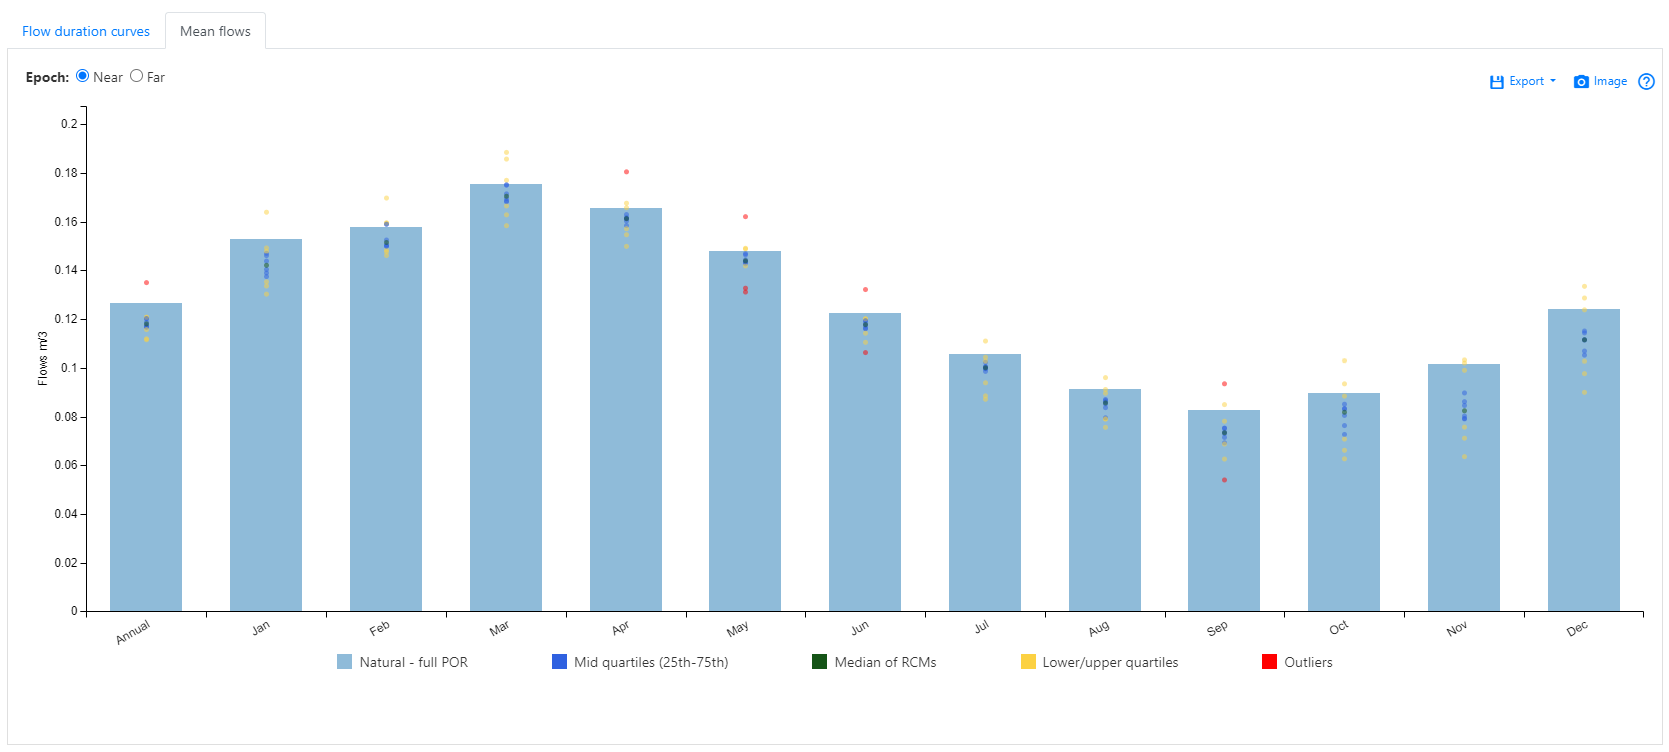
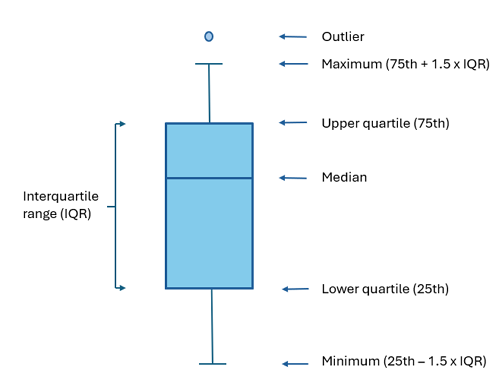
The natural (full POR) annual and monthly mean flows appear as solid light blue bars. The RCM runs are represented by coloured dots. The colour indicates where these fall within standard box plot quartiles. The figure below illustrates how these are calculated.
Tool tips show you individual flows for each RCM run.
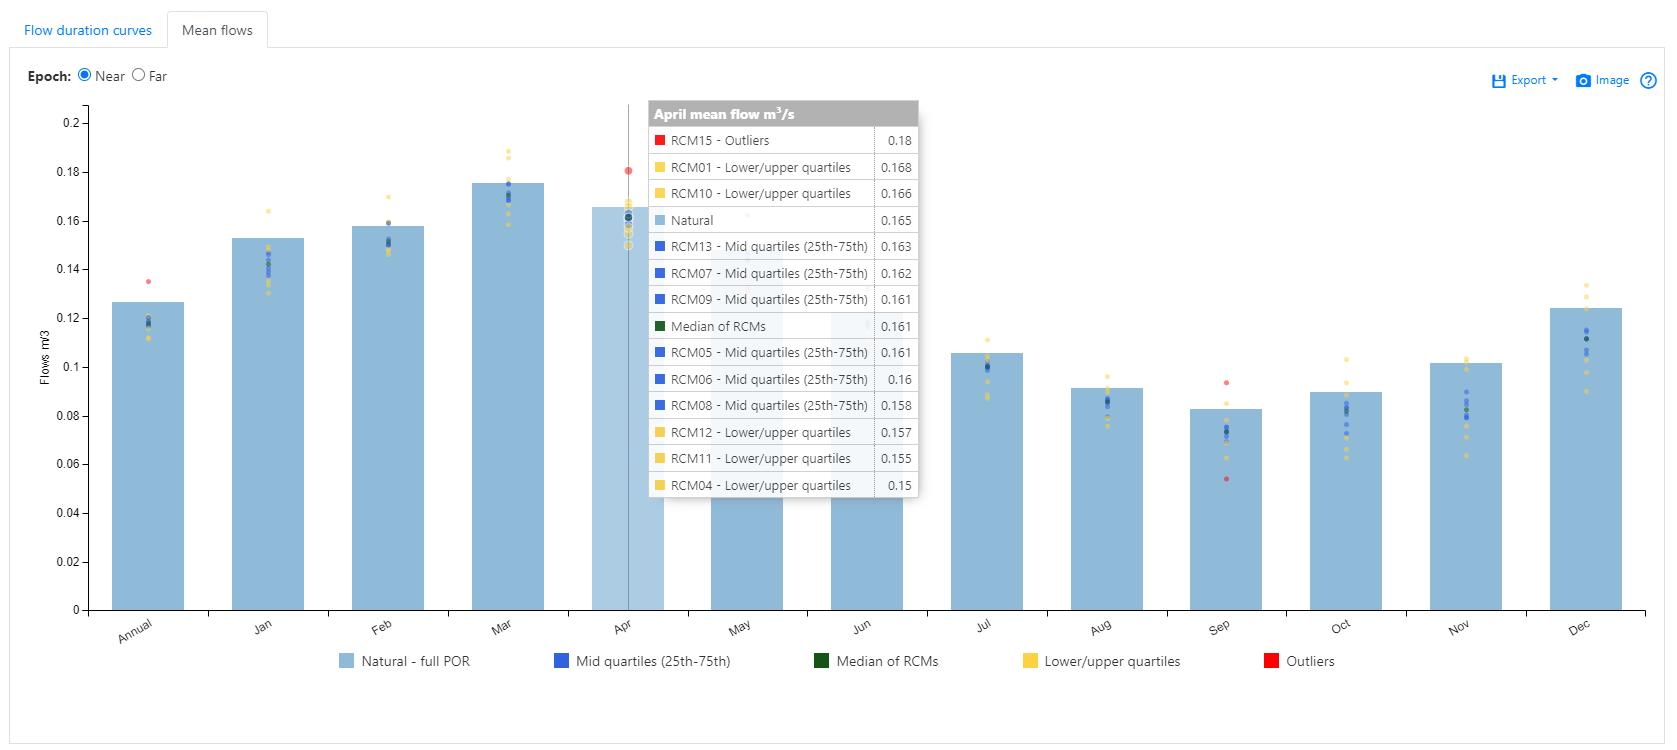
The RCM runs are presented in descending flow order.
The remaining tool bar functionality (export, image etc) is identical to the flow duration curve tab, described above.